.jpg)
PM Insights 2025 VC Market Review
Market data insights for venture-backed private companies.
January 9, 2026

PM Insights provides independent, market-driven data for Private Growth and Pre-IPO companies, providing unparalleled transparency and helping asset managers, consultants, banks, and regulators understand trading conditions and risk in this dynamic market.
This report analyzes private market performance in 2025, a year marked by strong but increasingly concentrated returns alongside rising volatility. Gains were led by high growth technology, particularly AI, while dispersion across sectors widened. Expanding bid ask volumes and heightened secondary activity reflected shifting investor sentiment and more active price discovery in private markets.
Key Takeaways
- PM50 Growth: ROI increased by 75.48%, while composite price volatility rose to 20.8%
- Sector Returns: AI led with a 144.82% return; Talent Management was the only sector with a negative return at -3.38%
- Revenue Multiple: xAI recorded the highest revenue multiple at 564x among the top 5 most active names
- Quarterly Bid-Ask Volume: Volume rose to $48.60B in Q4 2025, up from $29.79B in Q3 2025
- Top Performer: 1X Technologies (NO) delivered the highest return at 3,070%
- SPV Growth: SPV participation expanded in 2025, with SPVs representing 51% of total volume (up from 38% in 2024) and 30% of transaction count (up from 22% in 2024)

PM Insights 2025 Reflection
In each of our prior annual reviews, our team has emphatically stated that private markets are going to be more relevant than ever in the year ahead.
That trend is very much still on, in our view, and the rationale behind it is compounding as we move into 2026.
Access to higher returning asset types remains a core theme. Therefore, adding portfolio weightings toward venture and growth equity makes sense, particularly as barriers to entry are lowered with better liquidity and price transparency (thanks to PM Insights' data).
Also, as the Total Portfolio Approach (TPA) philosophy is increasingly adopted across institutional managers, a more pragmatic and flexible approach to allocation may well push even more funds towards this rapidly evolving part of capital markets.
Another important development is the thawing IPO landscape. As a firm, we are adding partners who advance data awareness beyond traditional listing disclosures, especially as more companies tracked on platform prepare for public offerings. Recent and pending growth company IPOs are showing promise and lessening duration risks endemic across private assets.
Venture-backed companies are at the forefront of technological disruption and AI is at the top of that list.

PM50 Growth Index YoY ROI
PM50 Growth Index '21 '22 '23 '24 '25
.png)
Long Live 2021 ROIs.
After a sustained rebound in private company valuations in 2024, during the most recent year the largest, most actively traded private growth stage companies knocked out of the park, with 2025 surpassing even the heady gains observed in 2021.
This was still however very much concentrated around the top tier companies like SpaceX, Databricks, Revolut and Stripe along with the AI darlings that continued to shine very brightly. Naturally many of them continued to take advantage of the rising tide in their valuations by running secondary market offerings, unlocking liquidity for their investors, employees and raising some capital to boot.
There are however more clouds on the horizon for 2026, especially around AI as both investors and enterprise customers become much more cost and ROI focused, and as the overall macro conditions look more uncertain.
Private & Public Market ROI
<row>
<col>
.jpg)
</col>
<col>
.jpg)
</col>
</row>
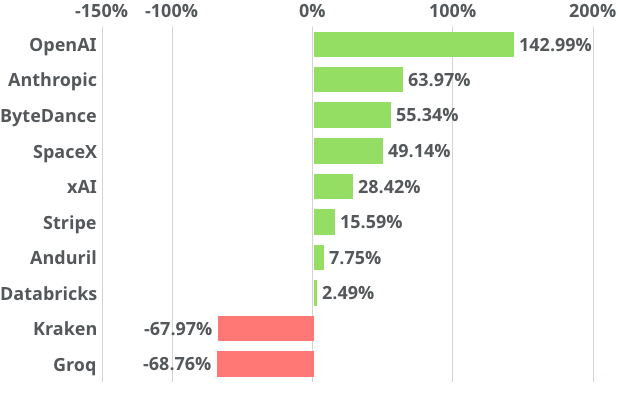
Sector ROI Change '24 to '25
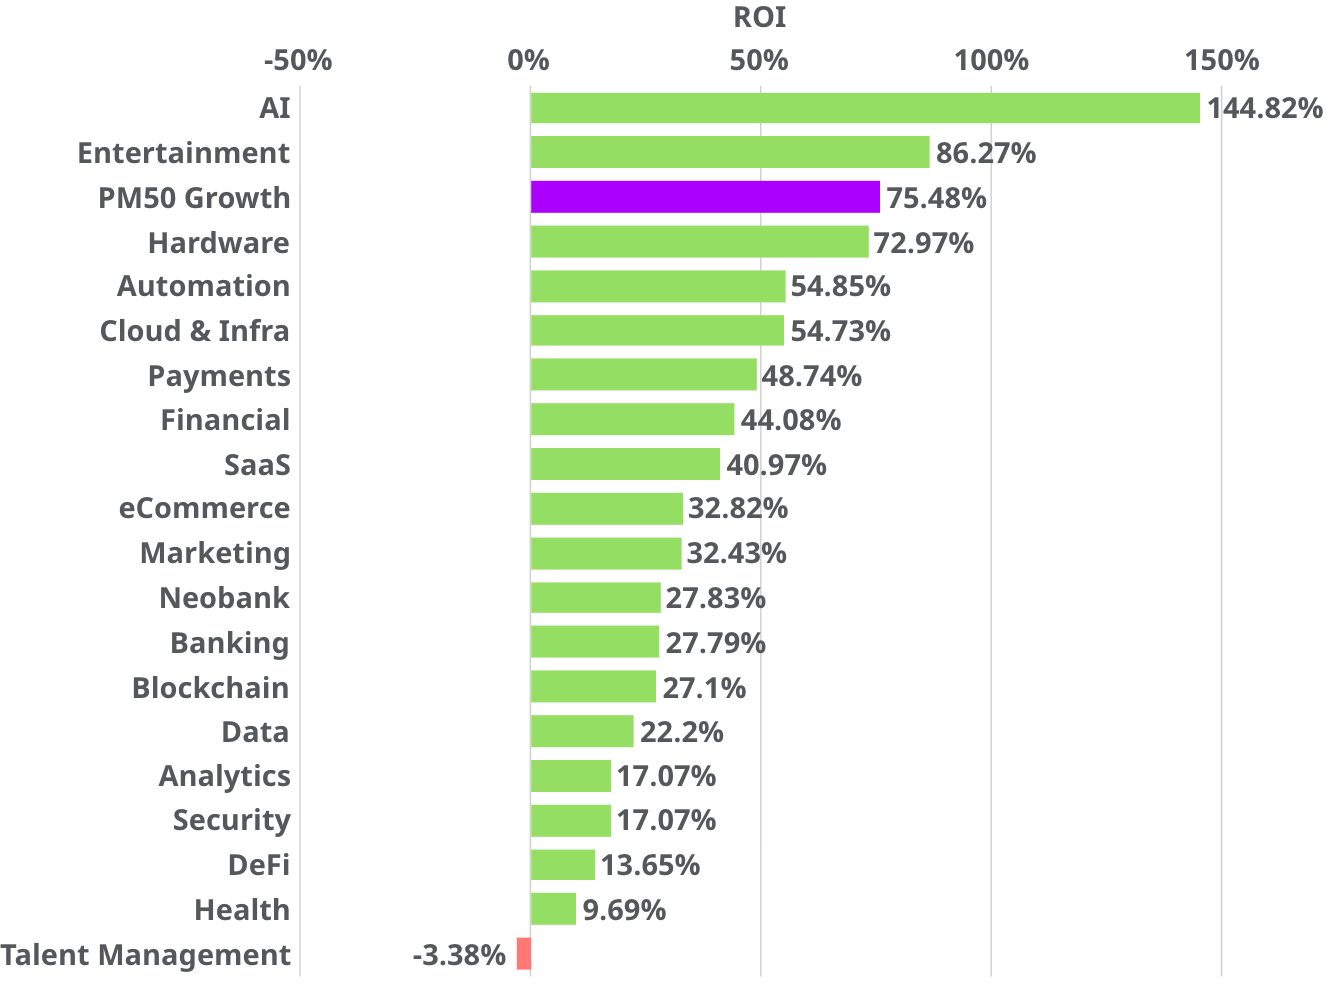
Most sectors see ROIs improving vs '24
AI was far and away the most dominant sector in 2025. With the largest of the pack - OpenAI, dramatically increasing their valuation on the back of moster fundraises and tender offers. Not to be outdone though, Elon Musks xAI and also Anthropic have also been keeping pace.
Also, Automation of all sorts, along with Hardware, Cloud & Infrastructure related companies performed well as the AI and defense and robotics related buildouts continue. Entertainment sector was also flying high, buoyed in part by a particularly strong performance by ByteDance.
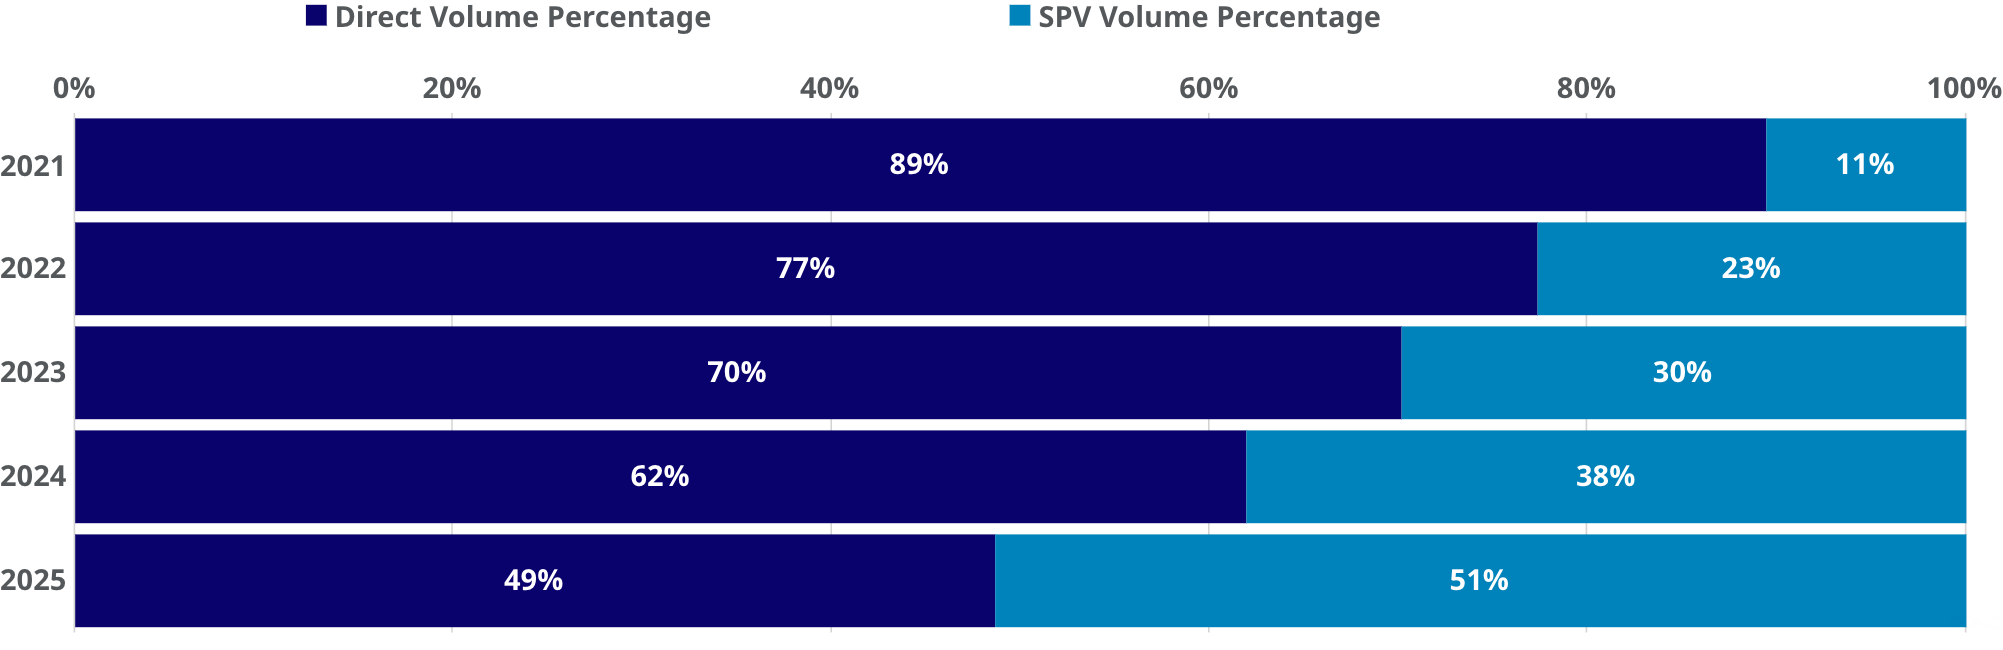
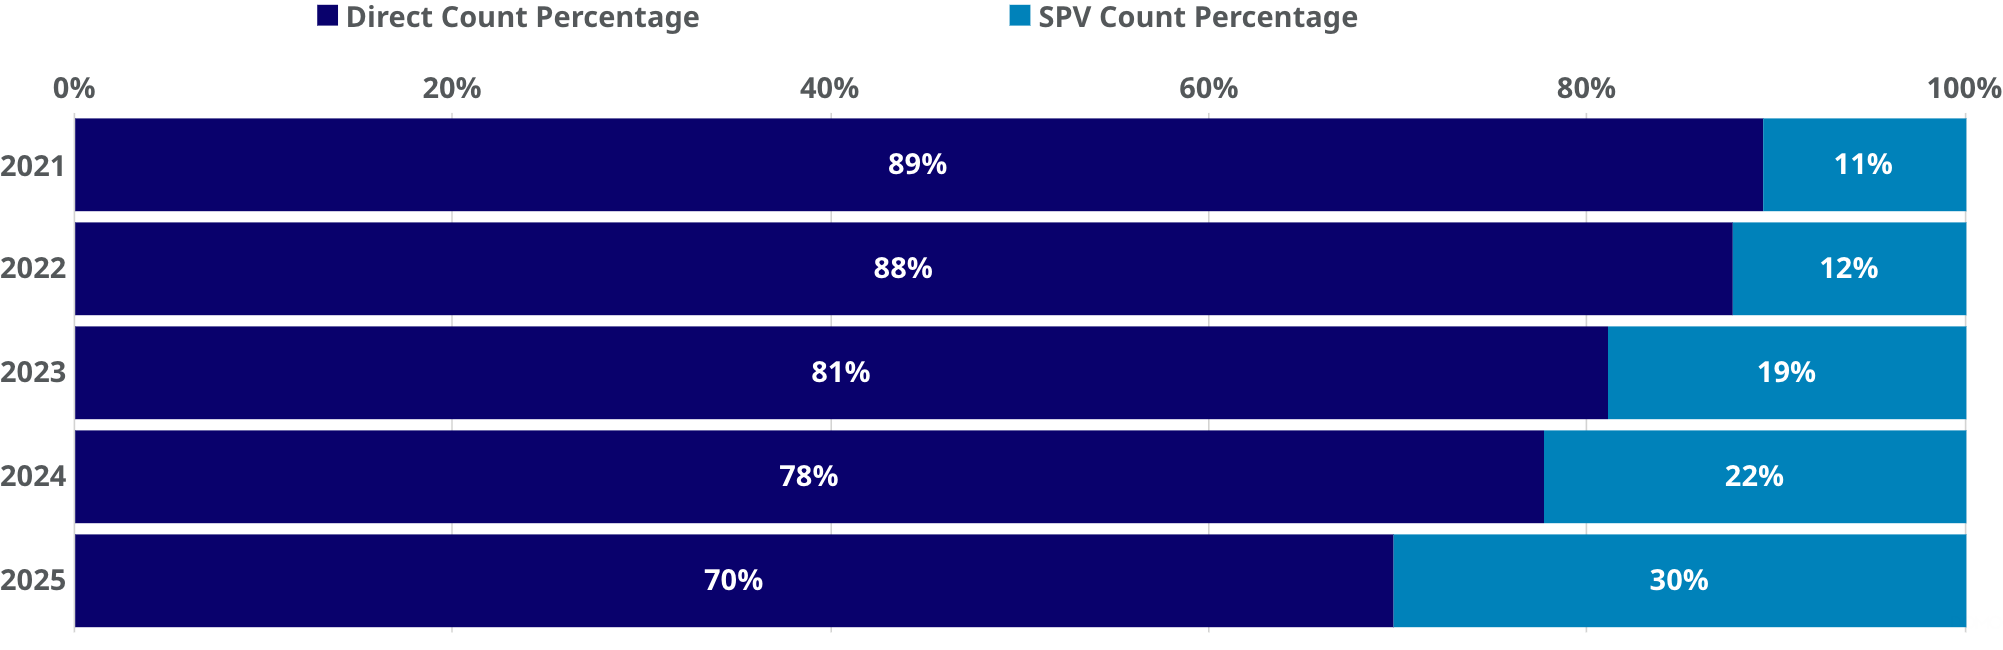
Observed Activity Split by Structure Type
<row>
<col>
Direct vs SPV as % of Volume
</col>
<col>
Direct vs SPV as % of Count
</col>
</row>
SPVs continue to grow their share of secondary market activity
The share of SPVs as a % of overall market activity rose in 2025, with both % share of volume and total observed trades & IOIs growing YoY. The fact that volume % increased substantially more than total count % indicates SPVs are increasingly used in larger, institutional sized transactions rather than smaller retail deals.
This trend signifies growing appetite for secondary market liquidity among existing institutional players (some previously expecting it from still-scarce IPOs), as well as new market entrants both at institutional level and an increasingly active RIA community looking to unlock access to this tech-heavy market segment for individual investors, who historically would have waited until IPOs for access.
Given growing interest and increasing company willingness to engage with the secondary market, these trends will likely continue through 2026, further fueling growth in the cottage industry around SPV set-up and servicing.
Private Companies ROI During 2025
Percentage of Companies with a Positive/Negative/Flat ROI 2025
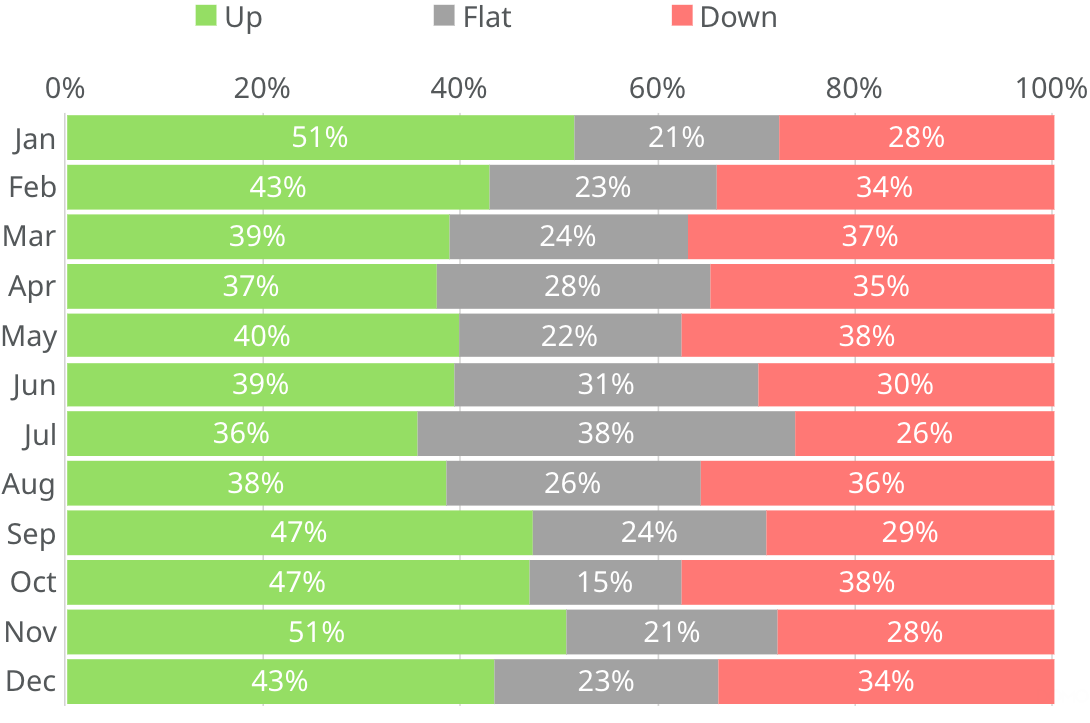
Mainly up and to the right.
Returns across private companies largely mirrored PM50 Growth benchmark's positive trajectory, with every single month showing net positive returns in 2025. Market confidence strengthened as industry leaders like SpaceX, OpenAI, Anthropic, Revolut, Stripe, and Databricks secured funding and liquidity through primary and secondary markets – some multiple times – at increasingly higher valuations.
2026's outlook remains uncertain though, even with anticipated rate cuts. Investors are starting to look more critically at the sky-high AI valuations and its infrastructure. Also, a lot more noise is being made about there being a bubble there, while at the same time the macro picture is increasingly muddled. The geopolitical risks however will likely continue to support the surging Aerospace and Defense sectors.
Revenue Multiples for some of the Most Active Companies
.png)
Note: The brief spikes in the data are due to new funding rounds / tenders that occurred
Revenue multiples for the most active companies on the rise.
Revenue multiples while generally on an upward trend, did give some mixed signals, with some surging dramatically on the back of exploding valuations relative to modest revenue growth, while in some corners, they have tightened as companies showed progress in sales with modest valuation gains.
The most notable growth has been from SpaceX, as they almost doubled their valuation in 2025 once again, so their revenue multiple climbed most steeply, towards the year end once again.
Anthropic was not far behind also raising multiple times in 2025 at ever higher valuations, thus driving up the multiple.
Full Year 2025 Bid to Ask Spreads & Volatility of Composite Price
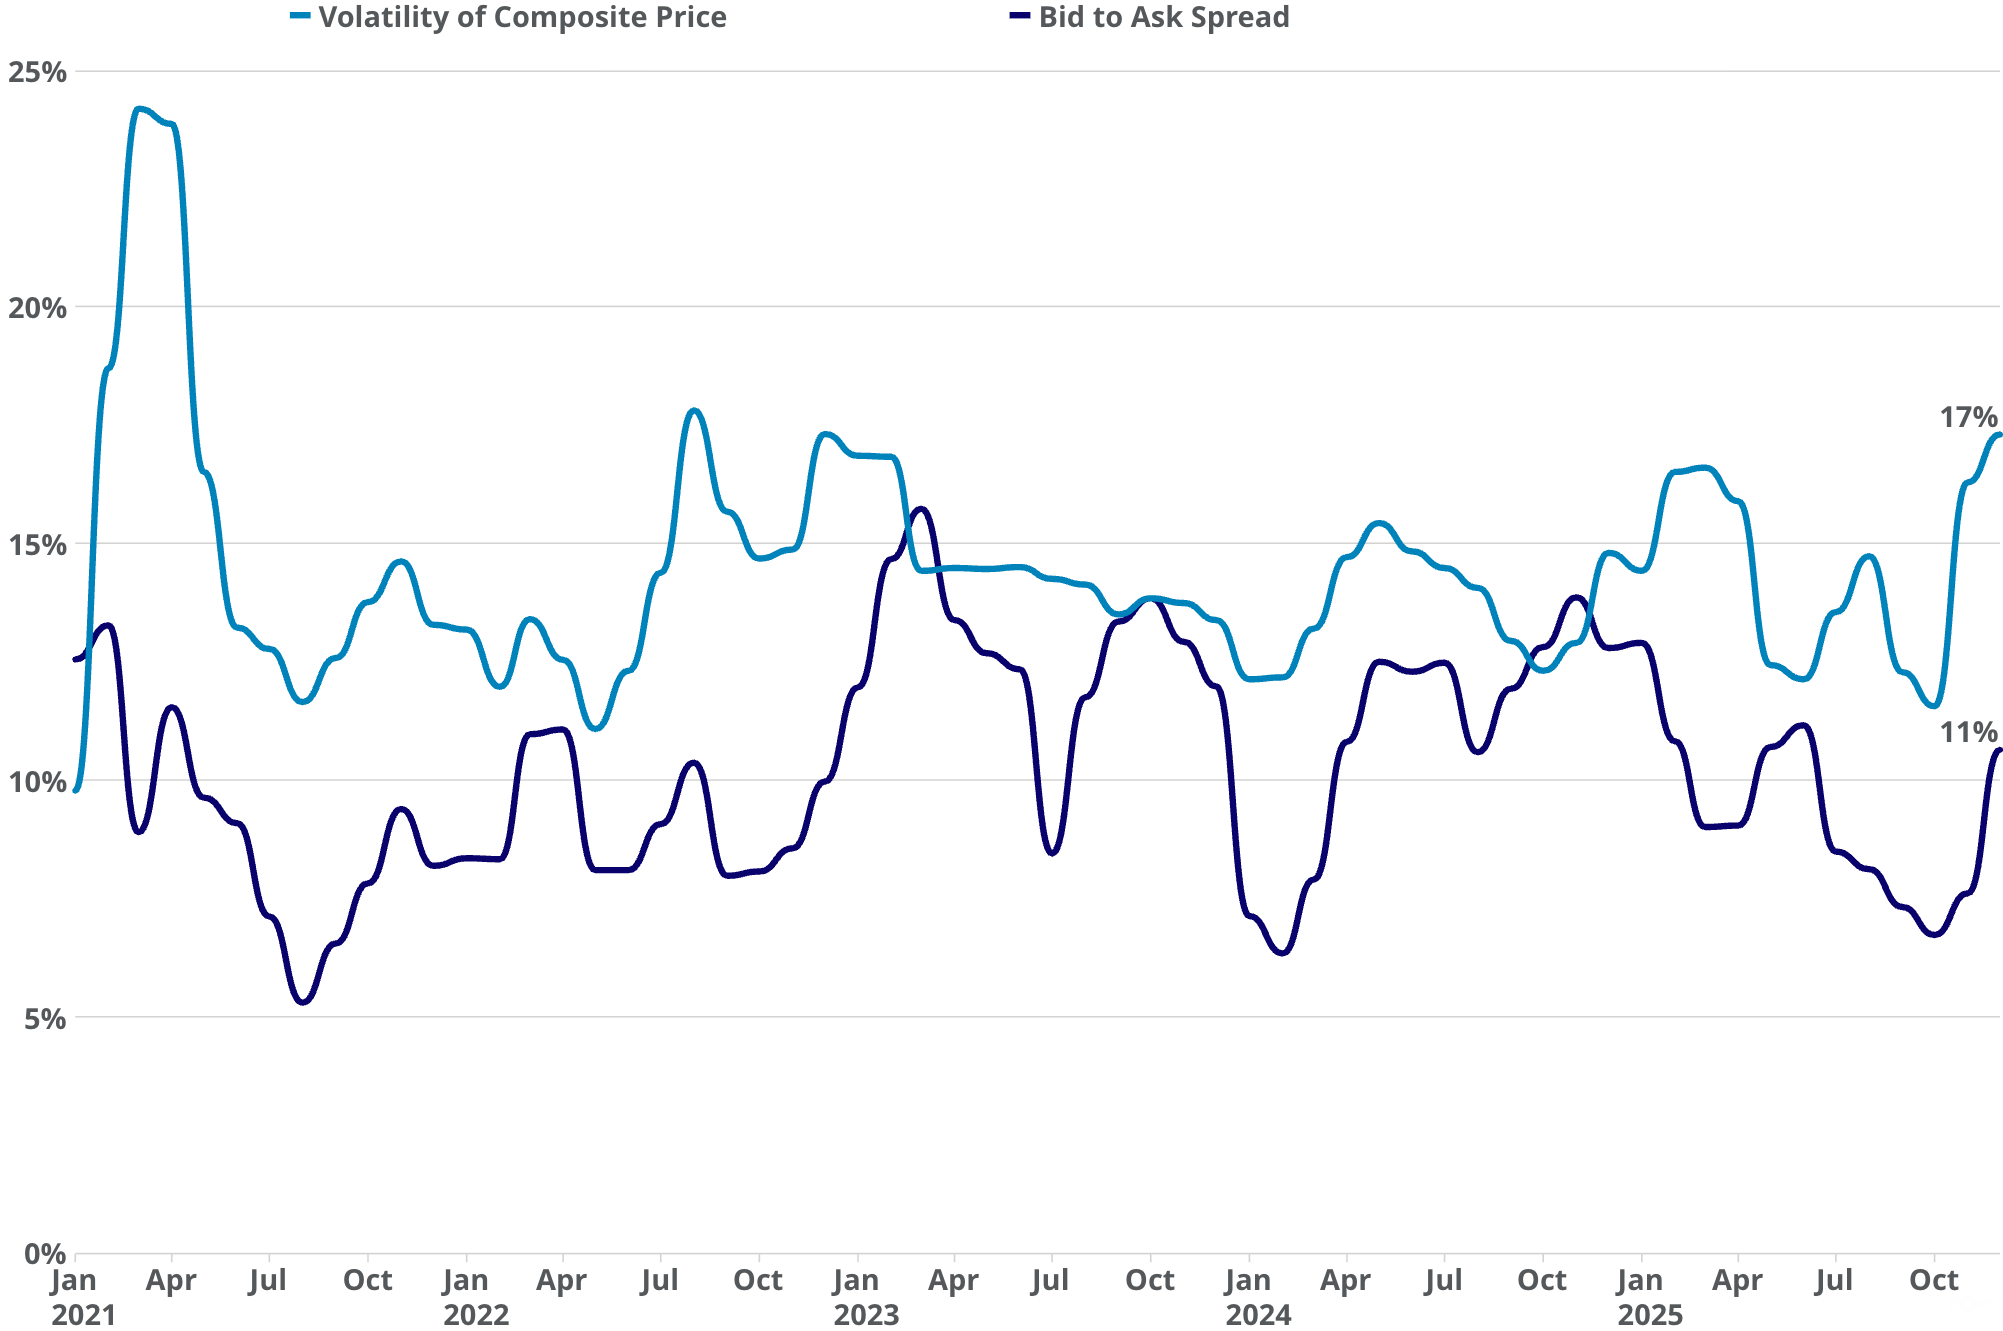
Both spreads and volatility ended the year higher than they started.
The recent increases in volatility have been mostly driven by upward movements across a number of leading companies, but there was also some downward pressure seen, most notably in Perplexity and even OpenAI, towards the end of the year, potentially signaling a cooling from investors towards these hyped names, given the scale of capital they continue to require (resulting in massive dilution of course) to maintain their primacy, spending eye watering amounts on infrastructure and talent.
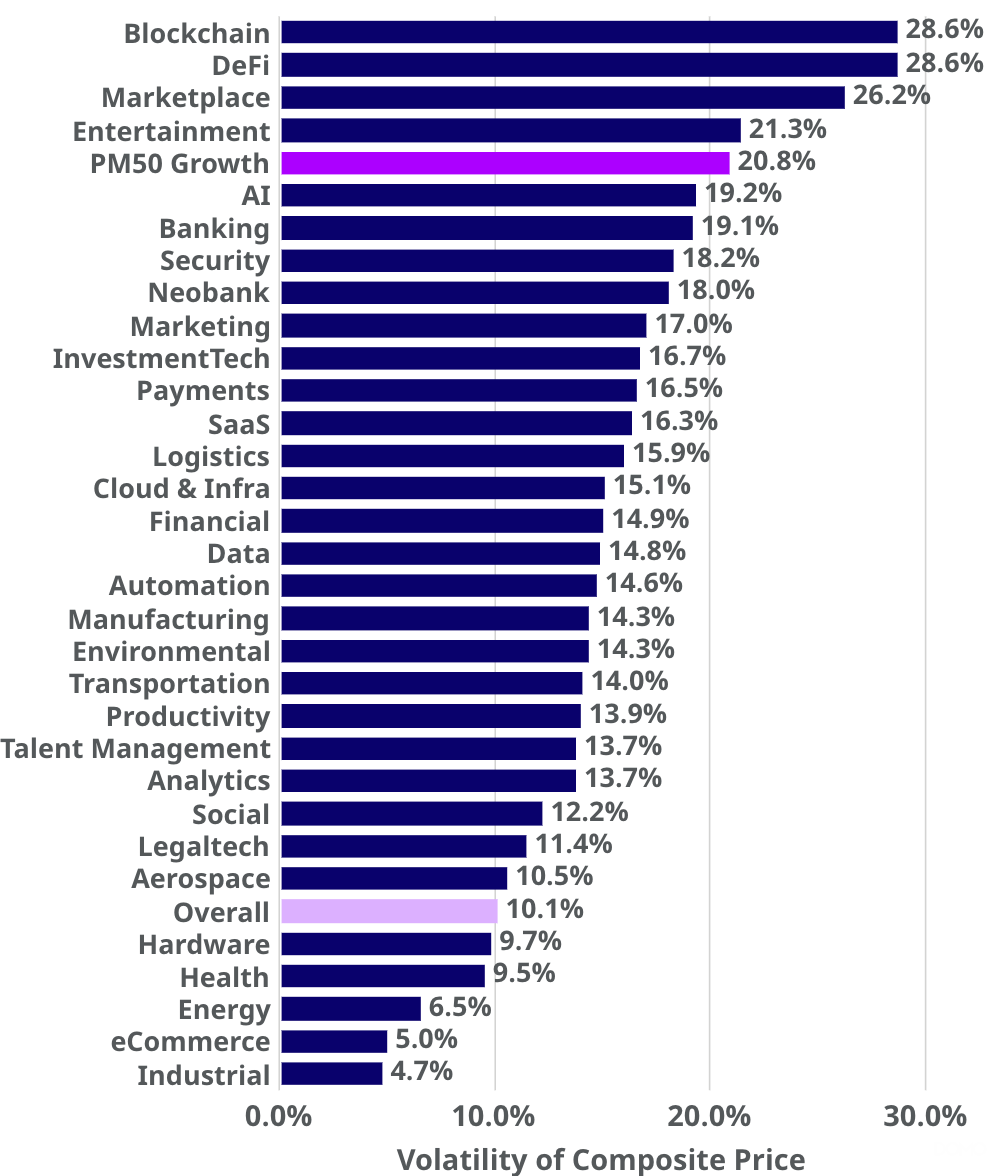
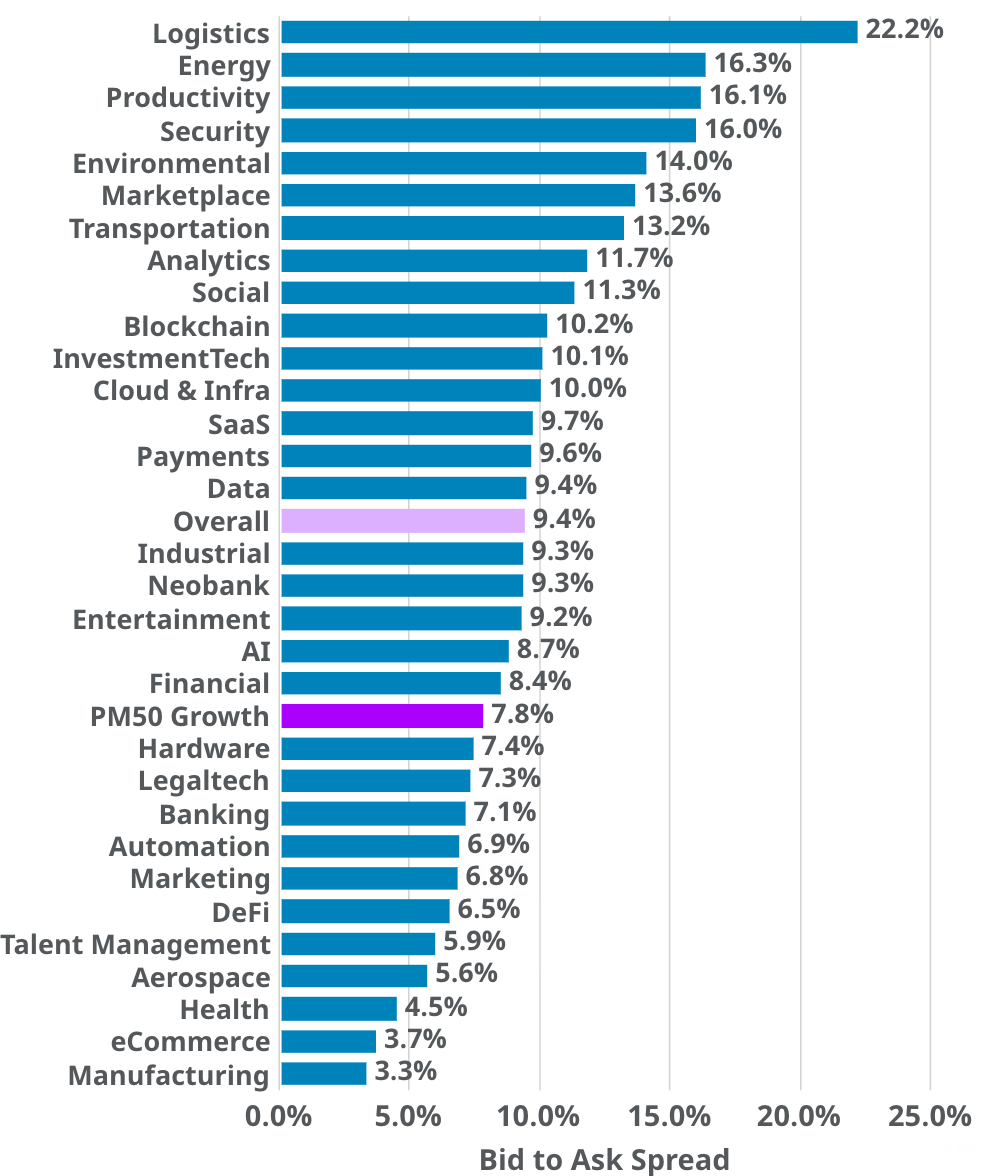
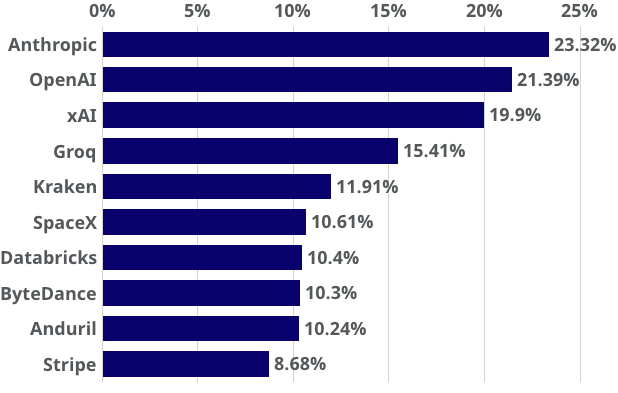
Sector Volatility & Bid to Ask Spreads 2025
<row>
<col>
Average Volatility Of Composite Price per Sector
</col>
<col>
Average Bid To Ask Sector Spread per Sector
</col>
</row>
Liquidity and hype driving spreads and volatility.
Higher spreads and volatility was seen across a number of sectors but for very different reasons:
Some sectors such as Blockchain, Defi and Marketplace were suffering a lack of liquidity and hence were more volatile.
While others, like AI, Neobanks & Entertainment were seeing more hype, increasing interest and resulting activity driving the volatility (and returns) up.
Average Bid & Ask Spread per Sector
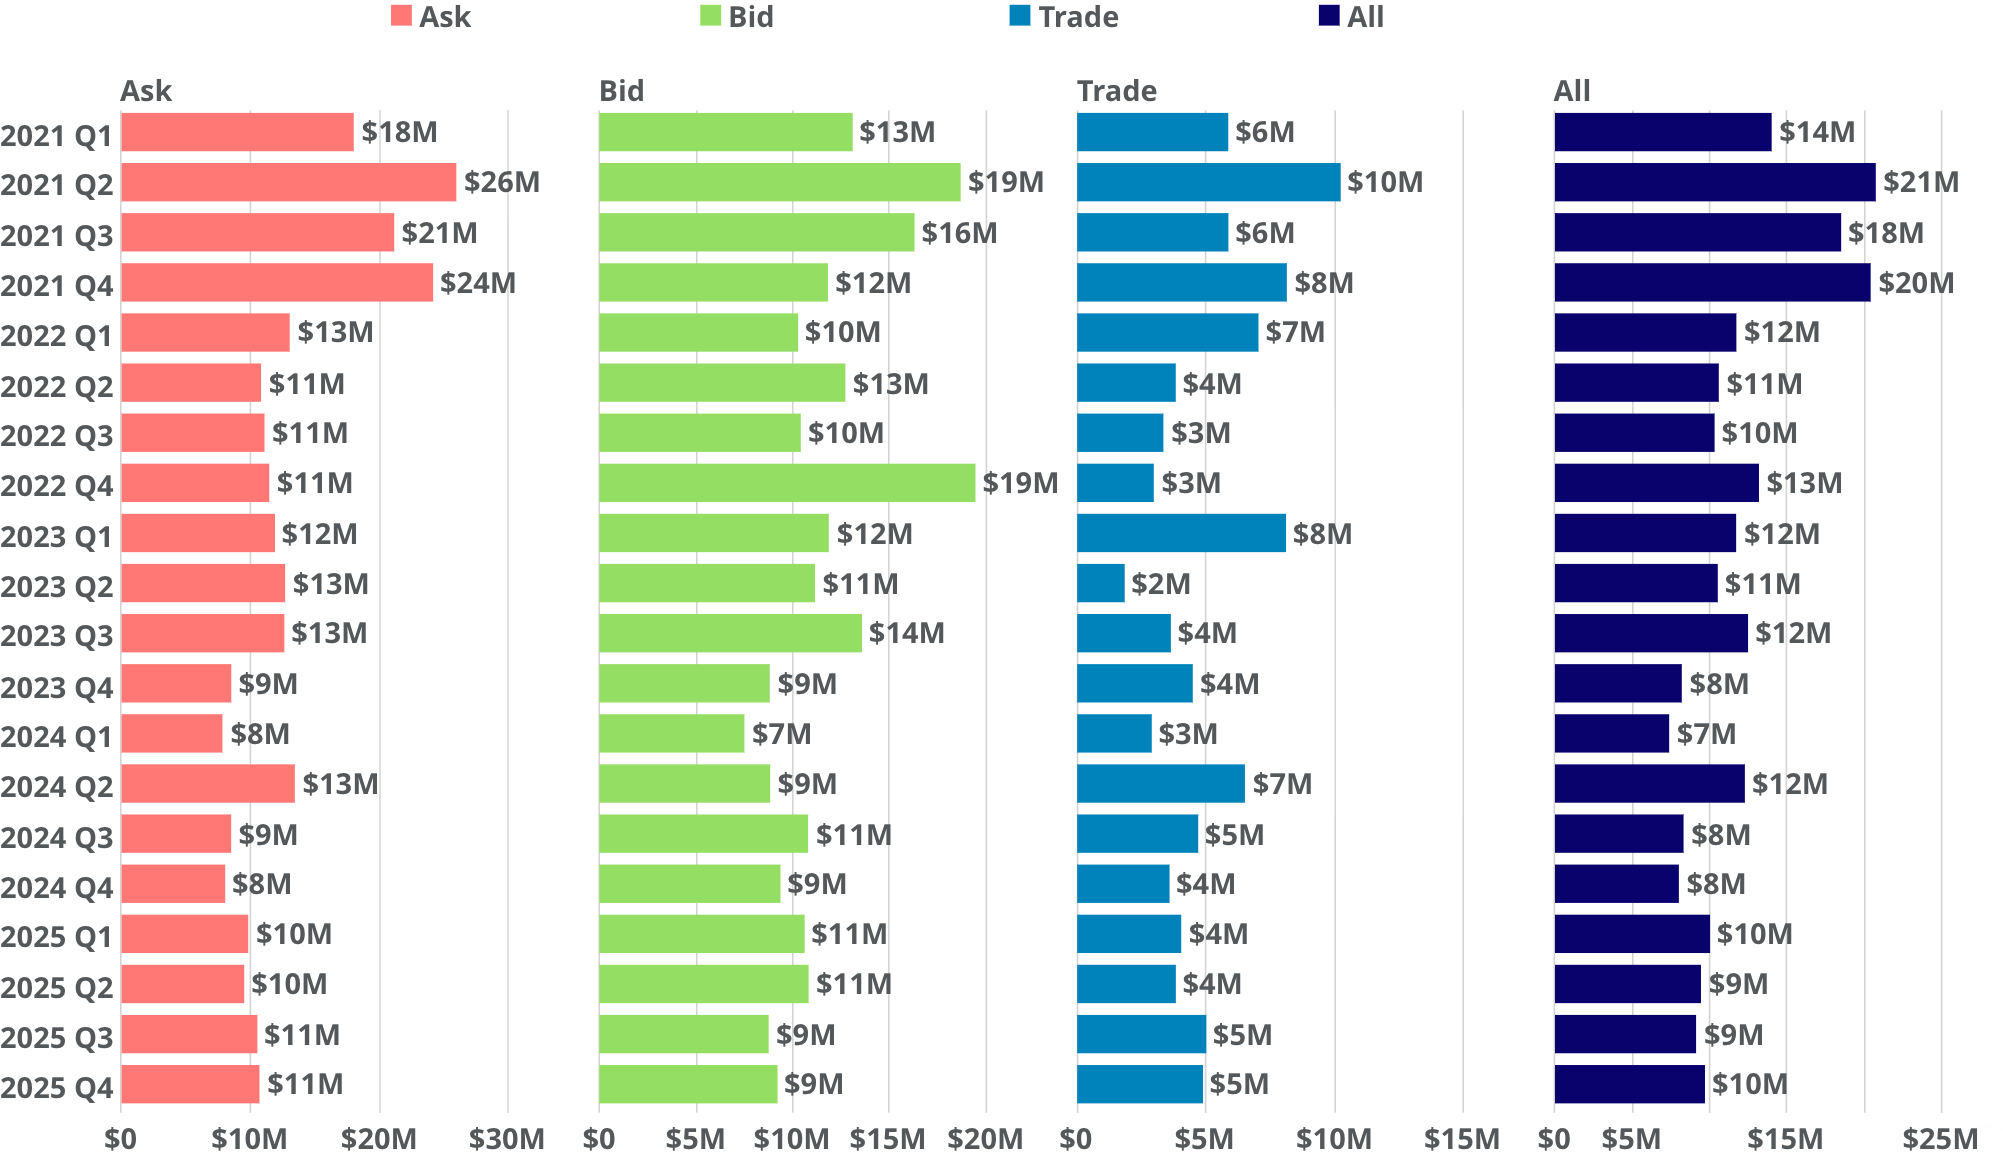
Quarterly Bid & Ask Volume
.png)
Bids losing momentum towards the end of the year.
Offers still make up the lions share of observed volume and after the spurt in bid-side share at the start of 2025 and leveling off in the mid 30s in the first 3 quarters, more sell-side pressure appeared to form in Q4 of 2025. Perhaps again signifying investors looking to take profits, specially across what many believe to be the very frothily valued AI names.
Mean Quarterly Volume per Indication Type
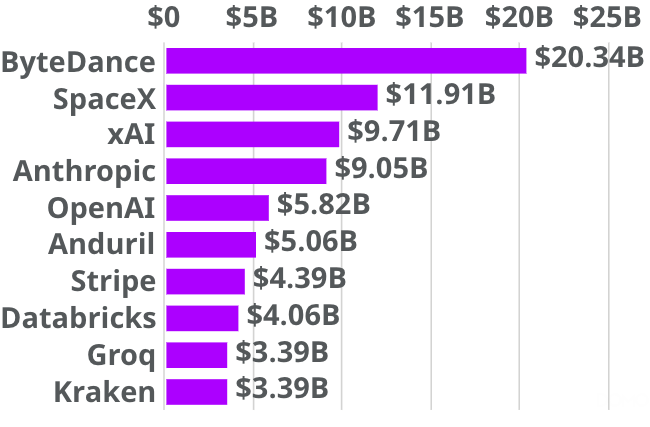
Top 10 Private Companies Based on Total Bid & Ask Volume
<row>
<col>
</col>
<col>
Bytedance and SpaceX remained dominant in 2025.
Volume based on observed broker activity has been dominated by the two titans - SpaceX & ByteDance, but Anthropic and xAI were hot on their heels this year.
OpenAI & Anduril led the rest of the pack which was not too different from the year prior.
</col>
</row>
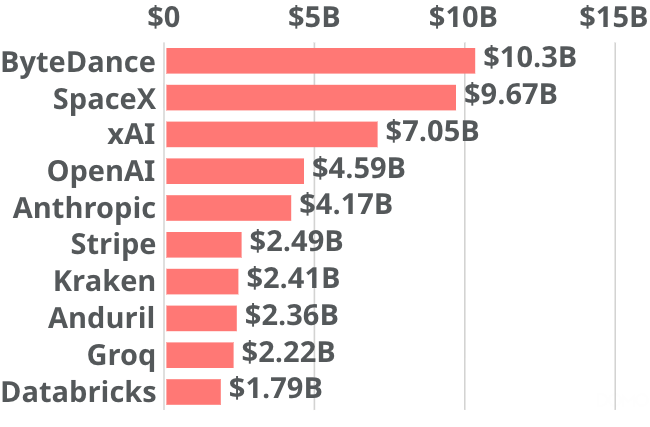
Top 10 Based on Bid or Ask Volume in 2025
<row>
<col>
Bid Volume
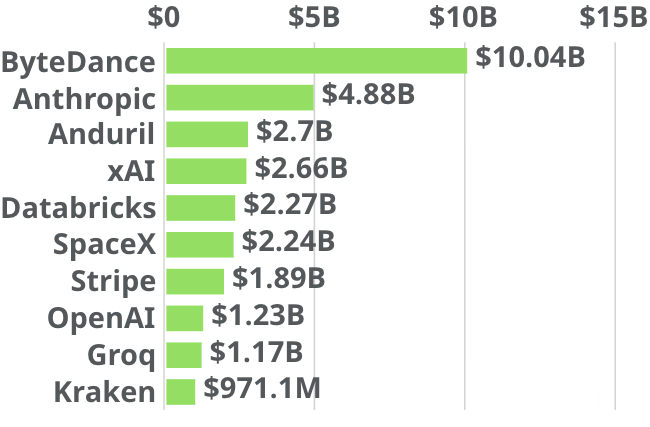
</col>
<col>
Ask Volume
</col>
</row>
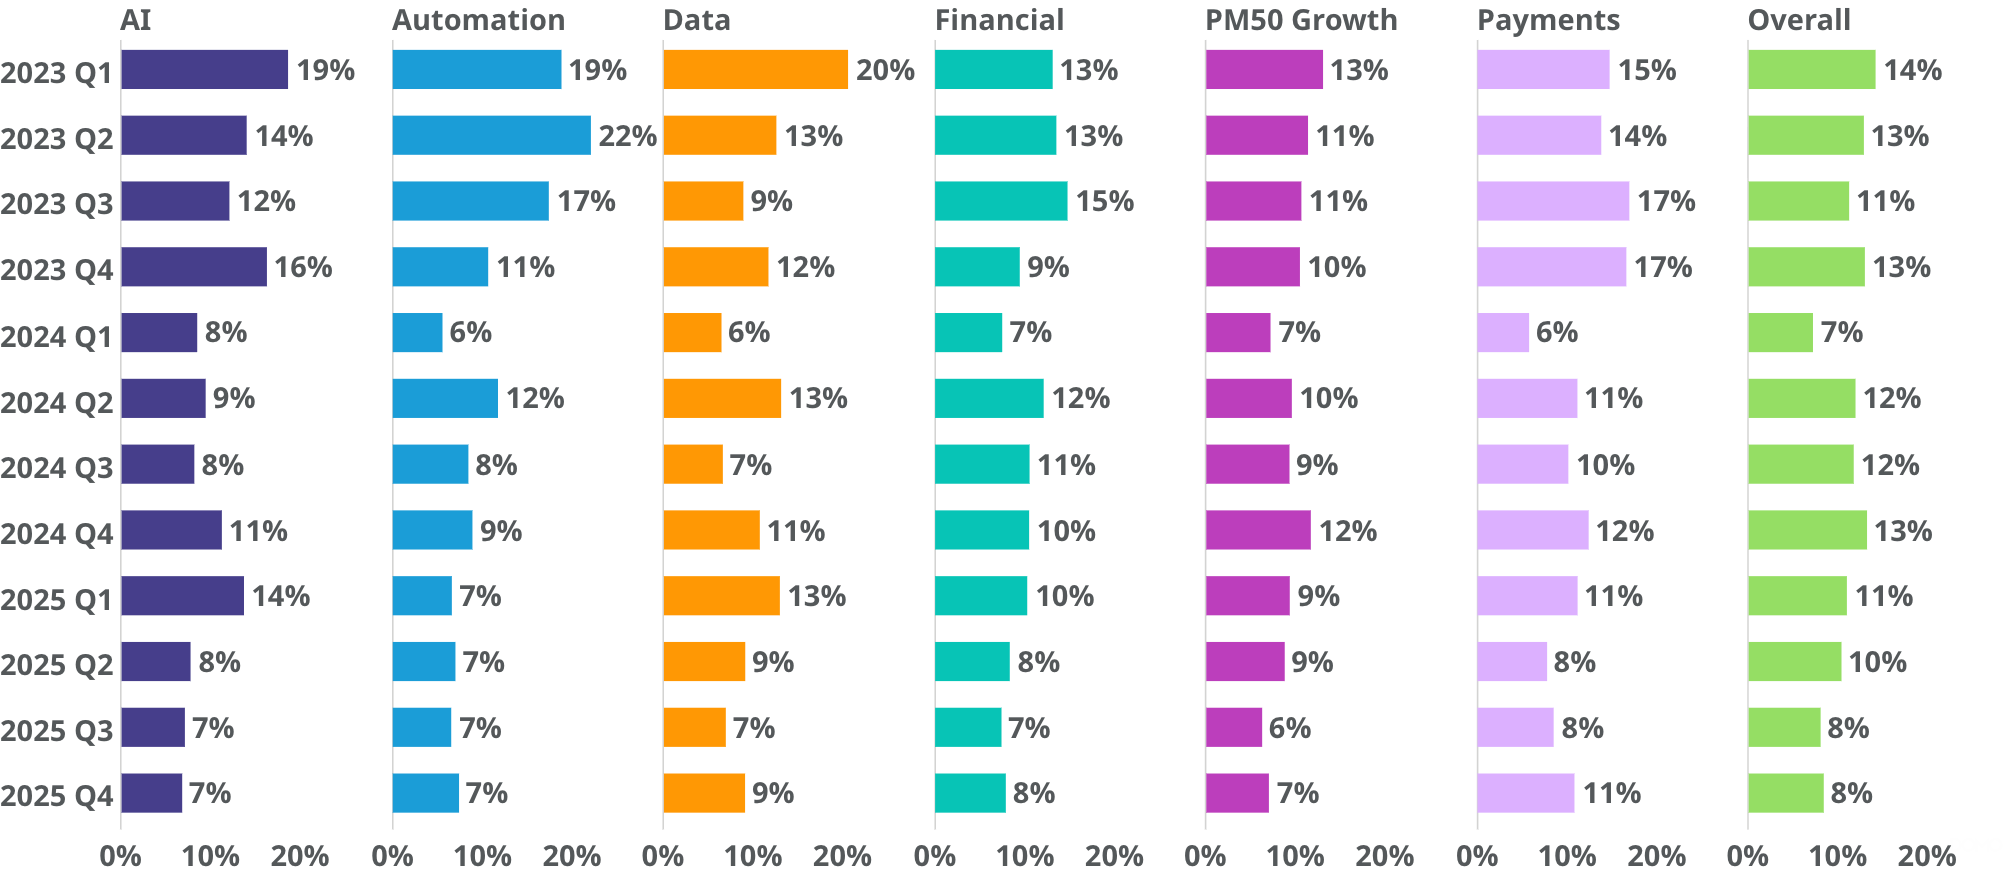
Volatility of Top 10 Companies 2025
<row>
<col>
Change in Volatility '24 to '25 for Top 10 Private Companies*
</col>
<col>
Volatility in 2025 for Top 10 Private Companies*
</col>
</row>
(*) Based on Total Bid and Ask Volume
AI volatile to the upside (for the most part).
Groq and Kraken prices were relatively stable, as compared to 2024, mostly moving sideways especially in the latter half of 2025. At the same time the AI names, along with Bytedance & SpaceX, knocked it out of the park and thus saw significant volatility to the upside as a result.
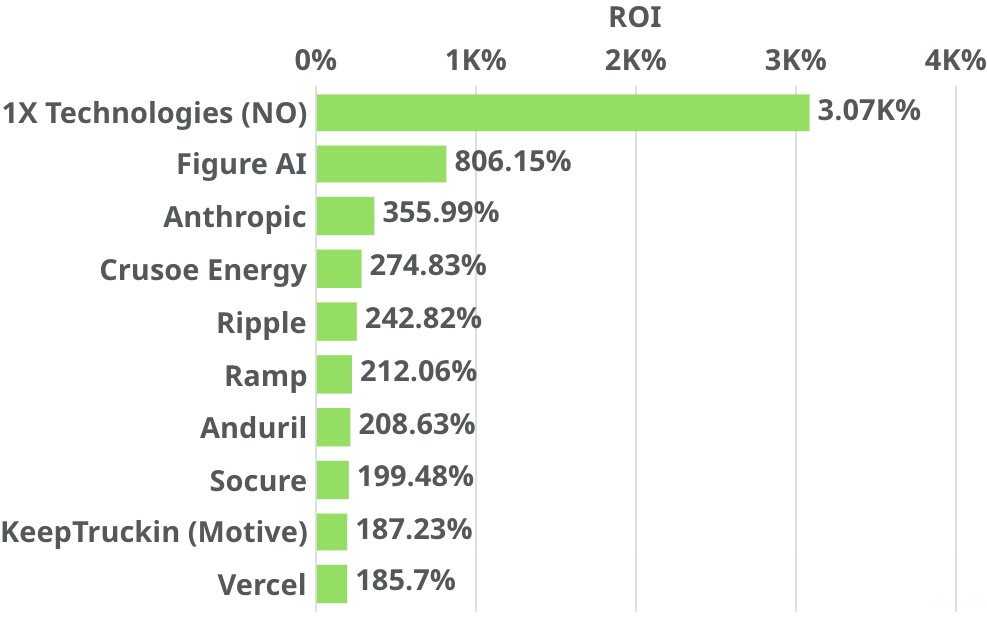
Top 10 Biggest Gainers & Losers for 2025
<row>
<col>
Top 10 Private Companies Based on Change in Price
</col>
<col>
Bottom 10 Private Companies Based on Change in Price
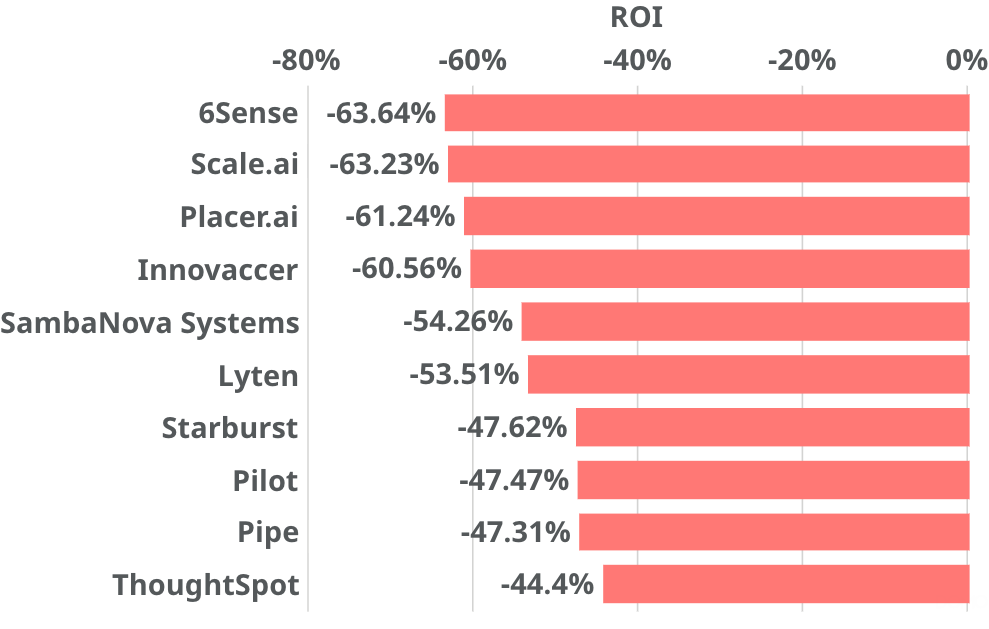
</col>
</row>
Robotics riding high.
Two robotics companies outperformed all the AI companies as the focus is starting to shift on AI in the physical world. Figure AI and, most notably, the Norwegian upstart 1X led the pack with astronomical gains in 2025. On the other side of the spectrum, despite having AI in the name, Scale.ai suffered some of the biggest declines observed on the back of the deal with Meta that took most of its top talent.
Proportion of Change in Valuation
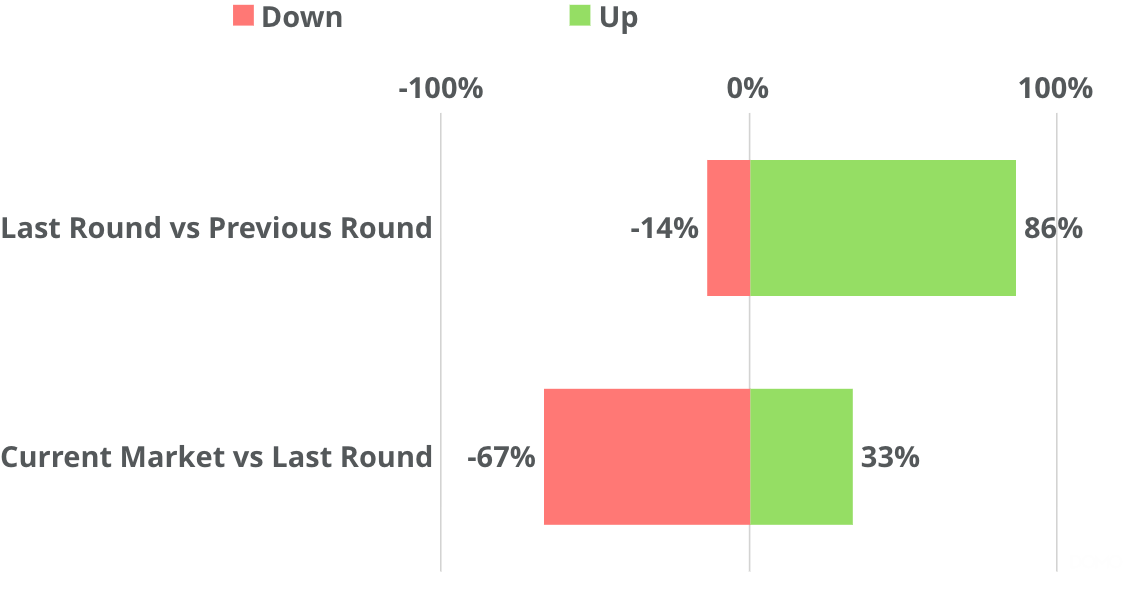
86% of companies in PM Insights’ universe were valued higher in their most recent round compared to previous round.
Still a significant proportion of secondary market activity is taking place at below most recent primary round valuation, likely due to a lot of capital concentration across a small section of outperformers in AI and elsewhere, with a significant number of companies still nursing themselves back towards pandemic era highs.
Those that do attract primary capital however are very much riding high, with uprounds once again dominant.
PM Insights Price vs Mutual Fund Price
PM Insights vs Mutual Fund Price Difference
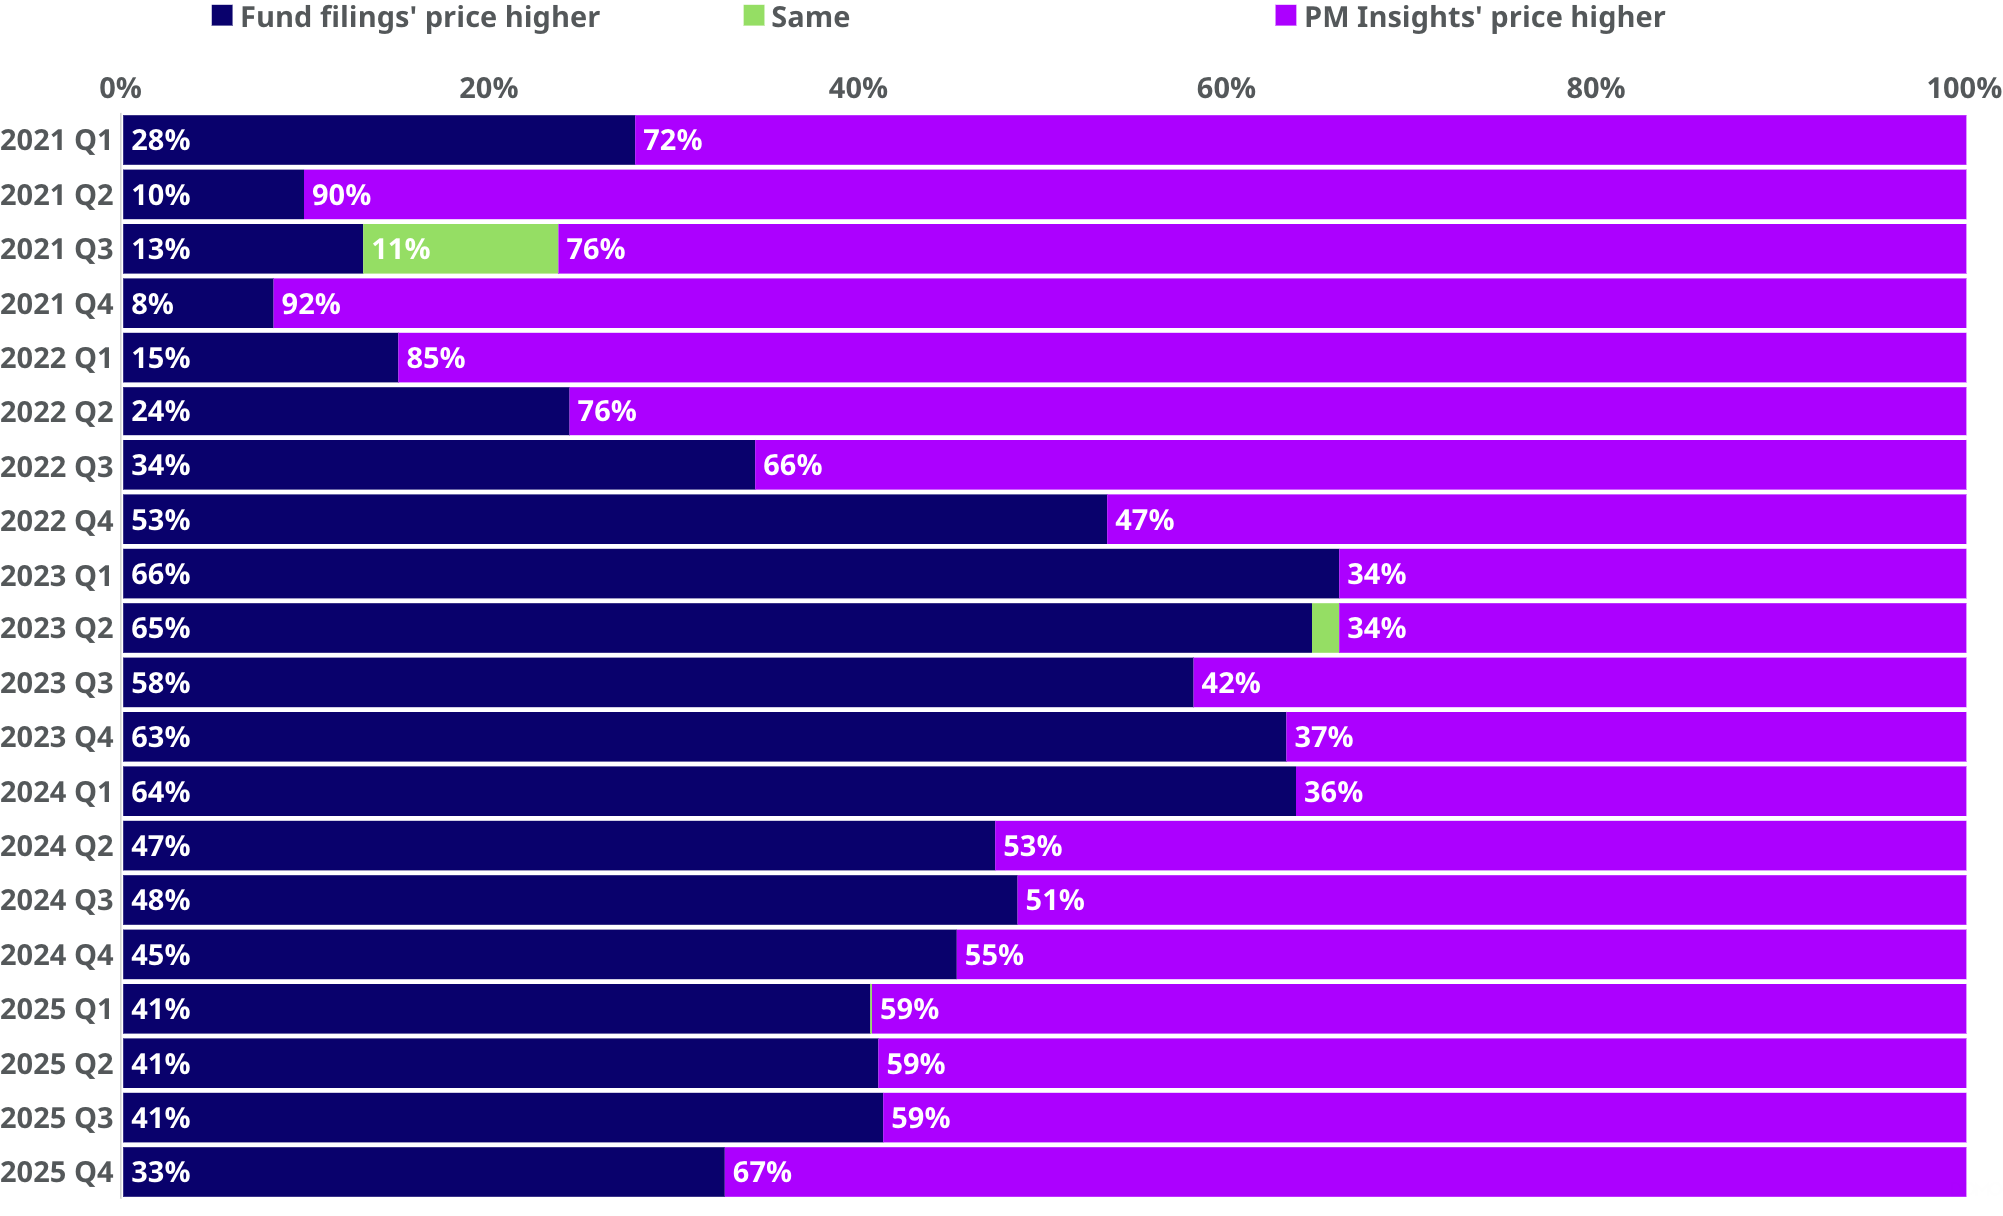
Most mutual funds appear to be following market activity more closely.
As market cooled off many of these funds were still slow to reflect the overall market sentiment, and increasingly PM Insights’ pricing (based on institutional secondary market activity) was below most mutual fund marks for those companies. However, this trend is reversing per the numbers seen in 2024 & 2025, which is in line with broader market recovery and positive dynamics, along with a growing number of funds marking more in line with the observable secondary market activity.
.jpg)
.jpg)
.jpg)
.jpg)
.jpg)
.jpg)
.jpg)
.jpg)
.jpg)
.jpg)
Ready to see it in action?
Schedule a demo with one of our experts
